
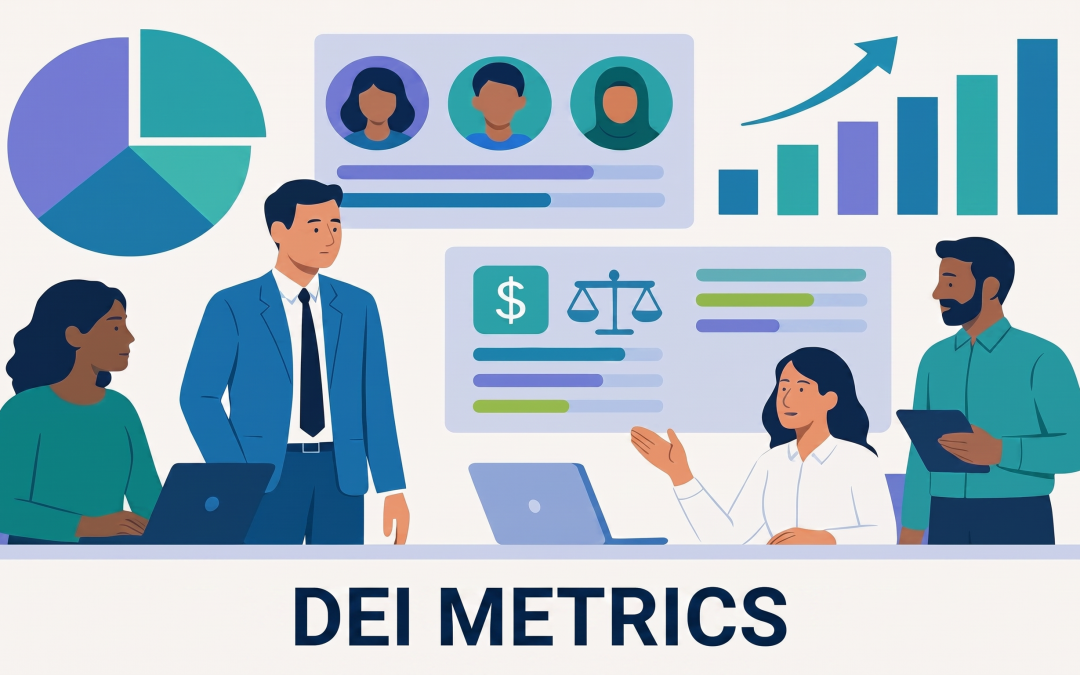
DEI dashboards are popular with HR teams. They love to showcase pretty dashboards to Executive Boards, but are often met with a barrage of questions with no answers. “Which groups are being promoted less, and why?” “Why do people leave?” “What’s going on with retention?
DEI dashboards can show diversity and inclusion among represented groups in the workplace (e.g., women, people of color); however, they capture count data rather than data that can identify homogeneity of opportunity and inequity in outcomes. Data Count tells us nothing about the equity or fairness of advancement opportunities.
Most people frame the conversation around DEI representation, the initial step in deciphering the DEI data puzzle. Framing primary constituent representation data capture is of little value to the organization. Getting a count of people is a first step, but it gives us a much more limited understanding of the progress people are making as a result of the opportunities available to them.
Counting Heads Won’t Cut It

Let’s call it what it is. Counting who is present is not a DEI measurement. It’s a headcount. There’s a big gap between knowing your workforce looks diverse and knowing your system treats people fairly.
Here’s a real example. Say your data shows 42% of your workforce is women. Looks great, right? But dig deeper. Women enter at 48% and leave before reaching the director level at twice the rate of men. The snapshot number looks fine. The real story sits in the pattern over time. You only see that pattern if you track people from hire to exit.
That’s the core problem. Most dashboards show one moment in time. Fairness problems live in patterns, not snapshots.
Three Things DEI Actually Measures
DEI is not one question. It’s three very different ones, and each needs its own approach:
- Representation: Who is in your workforce, and at what levels?
- Equity: Do all groups get the same pay, promotions, and chances for equal work?
- Inclusion: Do people from all groups feel like they belong and have a real voice?
Standard HR tools handle the first one well. They fall pretty flat on the second and third. That gap is where real problems hide.
Promotion Velocity: The Metric You’re Probably Missing
Promotion velocity tracks how fast people move up. It compares advancement rates across groups at each level. This one metric cuts right to the heart of equity.
Your overall promotion numbers might look fine. But look closer. Maybe one group waits an extra year before each promotion. Maybe they get passed over at the senior level at a much higher rate. Those gaps don’t show up in a simple diversity chart. You need to go level by level.
Track these numbers alongside your representation data:
- Time to promotion by group at each level
- Promotion rate gaps between groups
- Starting salary gaps for the same roles
- Bonus and raise distribution by group
These numbers tell you if your system actually works for everyone, not just on paper.
Why Aggregate Numbers Lie
Pay equity reports often say something like “women earn 98 cents on the dollar.” That sounds almost fair. But that one number hides a lot.
At the director level, the gap might be 91 cents. For women of color, it could drop to 87 cents. At the entry level, it might flip the other way. Averaging across all groups produces a result that appears acceptable. It often is not.
Actually, the overall picture can look healthy and still hide serious problems just one level down. Always break your numbers down by level and group. That’s where the truth is.
Connect Your Data to Action
Here’s where most organizations drop the ball. They collect great data. They build a report. Then nothing changes.
Good DEI measurement links every metric to an action. You track what you changed, when you changed it, and what happened after. That loop turns data into real progress. Without it, you have a report sitting in a PDF.
Ask yourself this: Can you show that a specific program closed a promotion gap for an underrepresented group? If you can’t point to a before, an action, and an after, you don’t have measurement. You have a document.
Start Here
You don’t need a massive overhaul. You need the right questions.
Start with a few metrics that go beyond headcount:
- Track promotion rates by group at each level
- Run a pay gap check broken down by level and group
- Survey your team on belonging and fairness every quarter, not once a year
Count who shows up, yes. But also track who gets ahead, who earns fairly, and who actually feels included. That’s where the real story is.